How to Build a Lightweight Analytics Dashboard for Product Page Conversion
Product pages sit at the center of most ecommerce journeys. They are the moments when curiosity turns into buying intent. When people arrive at the product page but leave without buying, the business misses an opportunity. Knowing product page conversion is critical for business growth.
Instead of guessing what people want, companies can use analytics to learn from the patterns of people’s browsing and buying behavior. A simple analytics dashboard can help teams understand these patterns without overwhelming them with too much data. The goal of analytics is to simplify, not confuse. By focusing on the basics, companies can immediately spot working product pages, non-working product pages, and where to focus for the greatest impact.
Table of Contents
The Value of a Lightweight Dashboard Approach

Many e-commerce dashboard implementations fail because they try to convey too much data at once. People are left looking at dozens of charts without understanding what they should be looking at.
A lightweight dashboard, on the other hand, displays only metrics that directly impact conversion on the product page. The idea is to be simple and clear. By focusing on only the most important metrics, businesses can recognize trends more easily and act on them more quickly.
Rather than waiting for detailed reports, managers and product teams can see what is happening in real-time. This simplicity also makes the dashboard easier to maintain. A simple approach to analytics makes it more viable for day-to-day decision-making.
Start with the Core Conversion Metric
All product analytics dashboards start with only one question: how often do visitors convert? Product page conversion is usually measured as the percentage of visitors who take action after visiting the page.
This action may involve adding the item to the cart and purchasing it. It is important to establish consistency so that everyone understands the metrics. Inconsistencies may lead to different teams drawing different conclusions from the same set of numbers.
After defining the core conversion metrics, they become the basis for the dashboard. All other analytics, such as traffic and other conversions, should be used to understand the reasons for the fluctuations in the core conversion metrics.
Tracking Product Page Traffic Sources
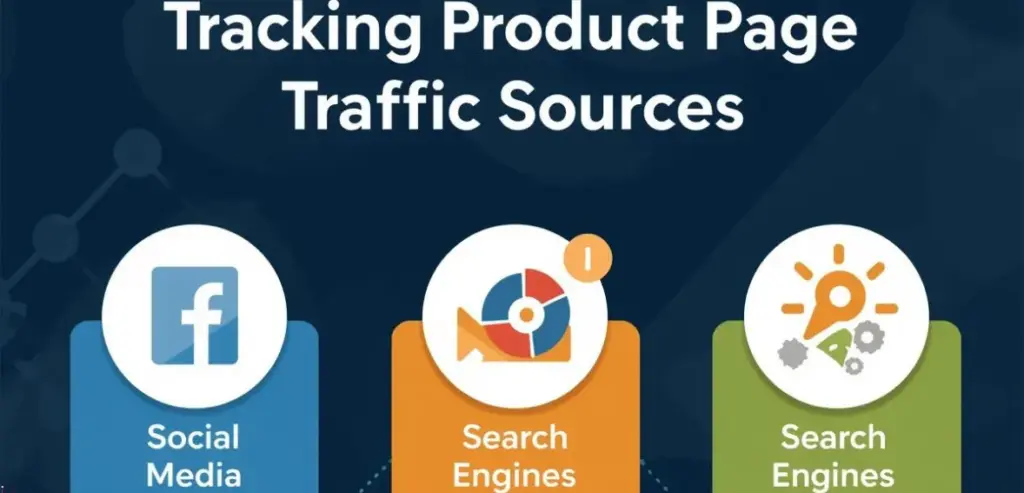
However, the data on conversion rates will only be useful if combined with traffic information. For example, if the product page attracts many visitors but few conversions, the business might be failing to meet customer expectations.
Conversely, if the product page attracts few visitors but achieves high conversion rates, the business might be tapping into a lucrative niche. The dashboard should also include information on traffic sources, such as search engines, advertisements, social media, and the site’s navigation.
This will enable the business to assess the quality of its marketing campaigns. Marketing strategies can then prioritize channels that consistently bring high-intent visitors to product pages.
Measuring Engagement on Product Pages
Engagement metrics give us an idea of how visitors interact with the product page before they decide to purchase. For example, metrics such as “time spent on page,” “image interactions,” and “scrolling” give us an idea of whether customers are engaging with the product’s details.
If visitors are leaving the page too quickly without engaging, it probably means there isn’t enough visually appealing content or information. If engagement is high and conversion is low, it suggests there are probably pricing issues. By using engagement metrics in this dashboard, we can gain deeper insight into customer interactions. Engagement metrics give us data on visitors and turn it into actual insight.
Monitoring Add-to-Cart Rates
The add-to-cart action is another powerful way to measure purchase intent. When users add products to their shopping cart, it is a clear indication of high intent to complete the purchase. A lightweight analytics dashboard should be used to track the relationship between product page views and add-to-cart actions.
For example, if many users view a particular product but few add it to their shopping cart, it may be because there are few persuasive elements, such as reviews and guarantees. On the other hand, add-to-cart rates can be used to identify which products customers are most interested in. Businesses can then focus more marketing and inventory efforts on those products.
Visualizing the Conversion Funnel
A conversion funnel can help teams understand the process of conversion from viewing the product to finally purchasing it. This process may involve stages such as viewing the product page, adding products to the cart, initiating checkout, and finally purchasing the product.
By creating a visualization of this process, companies can clearly see where their customers drop off in the conversion process. For example, there may be a high drop-off between the cart and the checkout process, implying issues with shipping costs or payment methods. This process of visualization helps simplify complex customer conversion paths into clear stages, enabling teams to better understand them.
Highlighting Top-Performing Products
A good dashboard should be able to identify products that perform well in terms of conversion. This is because products that perform well can sometimes offer valuable lessons for businesses. Businesses can study what makes products perform well and use that to improve other products.
For example, products that perform well may have high-quality pictures, clear descriptions, and positive customer feedback. A good dashboard can also support a marketing strategy. This is because products that perform well can be used to improve a marketing strategy. By using high-performing products, businesses can improve their e-commerce performance.
Identifying Weak Product Pages
However, not all products perform at the same level. Identifying underperforming pages is another vital role of an analytics dashboard. A page that gets considerable traffic but few conversions may have various issues that prevent potential buyers from making a purchase. These issues may include unclear product descriptions, complicated pricing structures, and insufficient product images.
By monitoring underperforming pages in the analytics dashboard, teams can address these issues quickly. Monitoring helps prevent underperforming pages from going unnoticed for too long. Over time, it is possible to achieve considerable increases in conversion rates by improving underperforming pages. Improving underperforming pages is often one of the quickest ways to boost revenue without increasing marketing budgets.
Segmenting Conversion Data
Different customers behave differently depending on devices, location, and other demographic factors. By segmenting their analytics data, companies can better understand these differences.
For example, mobile visitors behave differently on mobile devices compared to those visiting from other devices. Similarly, repeat customers convert faster than first-time visitors. By segmenting conversion data on the dashboard, companies can develop strategies for different customer segments.
Mobile optimization, promotion strategies, and other marketing campaigns become more accessible with such insights. Additionally, companies can uncover hidden potential by identifying products that perform better with certain customers. A good dashboard helps teams explore these insights without over-complicating the data.
Designing a Clear Dashboard Layout
Dashboard design is also important because it can greatly impact the effectiveness of teams using the analytics. A messy design makes it hard for teams to understand insights, while a clean design makes it easy. The conversion metrics should be placed at the top of the dashboard, followed by the supporting metrics such as traffic, engagement, and conversion funnels.
Charts and graphs help teams quickly understand insights and detect sudden changes in performance. A good design also makes teams want to look at the dashboard often, rather than just using it occasionally. If teams can understand the analytics, they will naturally start using them for decision-making.
Using Dashboards for Continuous Improvement
The analytics dashboard is most effective when utilized over time to improve processes. The product page is constantly changing, with businesses adding new images, descriptions, pricing models, and promotional copy.
Using a dashboard to monitor these changes enables teams to assess their effectiveness over time. If a new design is effective in terms of conversion rates, teams can use this data to improve other product pages. Similarly, if a change is causing a decline in performance, teams can adjust strategies to prevent further losses.
This cyclical process is beneficial for experimentation and data-driven decision-making. Over time, small wins compound into significant increases in revenue and customer satisfaction. A lightweight dashboard ensures that all stakeholders in product optimization are utilizing these insights effectively.
Conclusion
E-commerce teams may concentrate on what really drives sales by creating a lightweight analytics dashboard for product page conversion. Businesses can get a clear picture of how customers interact with their products by focusing on key indicators such as traffic, engagement, add-to-cart behavior, and funnel progression.
The dashboard’s greatest asset is its simplicity. Teams can react swiftly and confidently when data is simple to understand. Businesses can leverage targeted insights to inform marketing strategies and product enhancements, rather than being overtaken by complex analytics systems.
Stronger conversion rates and more effective product pages are the long-term results of this continuous monitoring. Quickly interpreting and acting upon analytics becomes a significant advantage in highly competitive e-commerce markets.
FAQs
What is a product page conversion rate?
It measures the percentage of visitors who complete an action on a product page, such as adding the item to the cart or completing a purchase.
Why build a lightweight analytics dashboard instead of a complex one?
A lightweight dashboard highlights the most important metrics, helping teams quickly understand performance and make faster decisions.
Which metrics should a product conversion dashboard include?
Common metrics include product page views, conversion rate, add-to-cart rate, traffic sources, and checkout completion rate.
How often should teams review the dashboard?
Most e-commerce teams review dashboards daily or weekly to detect performance changes quickly.
Can small e-commerce stores benefit from conversion dashboards?
Yes, even simple dashboards help small stores identify winning products and optimize weaker product pages.